Return to Figure 3 in the "Discontinuance" report
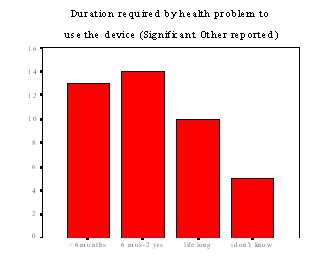
Figure 3: Duration required by health problem to use the device (Significant Other reported)

Figure 3 shows a bar graph which represents the duration required by health problem to use the device. In this graph, significant and other are reported. The title reads "Duration required by health problem to use the device (Significant Other reported)". Each of the four red bars within the graph represents a specified length of time as a function of counts. The x-axis lists the length of times required and titles each bar while the y-axis represents the count and ranges from zero to sixteen, counting by twos "0, 2, 4, 6, 8, 10, 12, 14, and 16". The four categories representing the four red bars that rise vertically from the x-axis starting from left to right are as follows "<6 months", "6 months – 2 years", "life long", and "I don't know". The first category "< 6 months" rises to a count of "13". The second category "6 months – 2 years" rises to a count of "14". The third category "life long" rises to a count of "10". The fourth and final category is "I don't know" and rises to a count of "5".
Return to Figure 3 in the "Discontinuance" report


